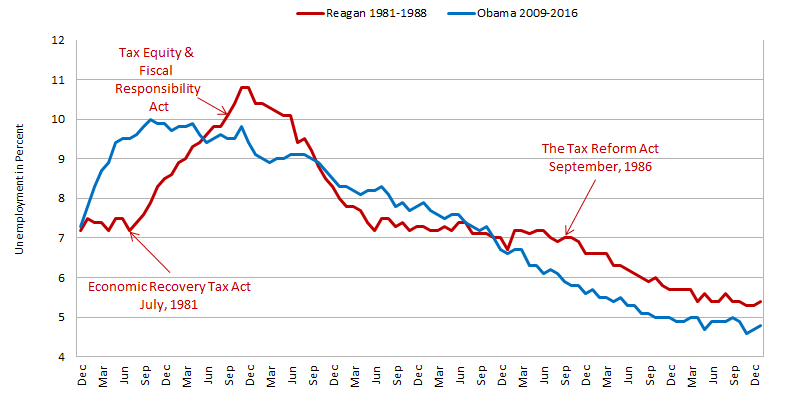
In exploring the unemployment figures of President Barack Obama and how they compared to those of President Ronald Reagan I was struck most by two facts: First, they share almost eerie similarities, and more importantly, very few people seem to realize how they compare and contrast. Many of the Right’s biggest pundits refer to Reagan’s two terms as the greatest era of economic prosperity in our history. While this is measured by many factors, unemployment is surely one of the biggest, and an accounting of Reagan’s numbers raises some questions.
Critics of Obama’s numbers jump immediately to the argument that the two periods are not comparable, citing that the Obama administration “cooked the books” by not counting those who stopped looking for work. The problem with this argument is that the Reagan administration did the same thing. The labor participation rate varied no more than 3% for both of them. Obama’s tenure includes the mass retiring of Baby Boomers (born between 1946 and 1964) that started officially retiring in his third year in office (2011). Roughly 4.02 million of them retire each year on average. That’s approximately 32 million people during Obama’s two terms (including millions of early retirees).
Here’s the chart:
The numbers tell a rather difficult story for proponents on the Reagan side. First, you’ll notice that Obama’s entry into office also coincided with job figures already marching skyward, while Reagan inherited a flat jobless number. Consider that Reagan’s predecessor, President Jimmy Carter, resided over four years of fairly flat unemployment that vacillated slowly between a lackluster “low” of 5.6% and a high of 7.8%. Carter came into office with it at 7.5% and left with it at the same number. Reagan supporters also generally credit his cutting taxes as the main reason for his low job figures, but as you can see from the data, that clearly isn’t the case. His tax cuts — passed into law in July of his first year — were part of the Economic Recovery Tax Act. The results were immediate and obvious. Employers started shedding employees at a record pace, culminating in the highest unemployment rate (10.8%) since the Great Depression and higher than Obama’s high water mark of 10.1%. In response, Reagan and Congress passed the Tax Equity & Fiscal Responsibility Act a year later. It was the first of several major tax increases during his two terms, and like the first act, its impact was quickly felt, resulting in a decline in joblessness nearly identical in sharpness to its previous rise.
Reagan’s jobless numbers then enter a long flat period, hovering mostly just above 7%, until the final major tax increases that came with the Tax Reform Act of 1986 just before his last two years in office. Only then did Reagan’s jobless numbers finally dip into the low territory that many supporters recall as the norm during his tenure. In fact, discounting the precipitous rise and fall of his first term, Reagan’s jobless figures would, at best, represent six years of stagnation above 7% before finally falling at the end of his administration. Unfortunately, that also coincides with the beginning of the recession that would ultimately cost his successor — President George H. W. Bush — his job.
By comparison, Obama’s jobless figures paint a much different picture. After riding out their initial climb to their peak in October of his first year in office, they were on a fairly reliable downward trend.
Another interesting footnote is that, in May 2012, Presidential hopeful Mitt Romney made a bold prediction: “I can tell you that, over a period of four years, by virtue of the policies that we’d put in place, we’d get the unemployment rate down to 6% and perhaps a little lower.” Obama managed this same feat more than two full years ahead of Romney’s promise. The best figure under Reagan’s administration was 5.3%. Obama’s administration reached that point 17 months before Reagan. Obama also surpassed Reagan’s best number in August of 2015 with unemployment reaching 5.1%.
The better argument for Reagan proponents is the average unemployment rate over a full administration. Reagan’s average was 6.3%. Obama’s average was 7.4%. Reagan came into office at 7.5% and left at 5.4%. Obama came in at 7.8% and left at 4.8%.
The big unknown is what Obama’s numbers would look like if he had worked with a more engaged Congress. Those on the Left would obviously suggest things could have been much improved, while those on the Right would say that the numbers were only low because of their opposition. Regardless of your view, the numbers are still quite interesting.


2 Comments
LOL always love a chart starting from 4
Charts often do not include numbers outside the range of the dataset presented. In this case, as there has never been zero percent unemployment, there’s no need to shrink the data you can see for the sake of data that doesn’t exist. Pretty simple.